
Prometheus Status

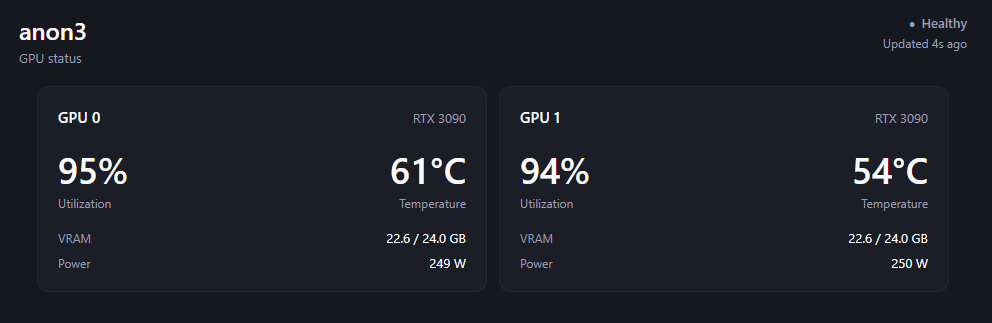
Prometheus Status shows GPU utilization, temperature, VRAM and power from a Prometheus server, in a status panel and a composer pill. The pill appears only when a GPU temperature needs attention.
Setup
You need a Prometheus server that the daemon machine can reach and that scrapes NVIDIA DCGM Exporter metrics. In the plugin's settings, enter the Prometheus URL, which is required. You can also set a metric selector to narrow the built-in queries, a host label, and custom queries if your metric names differ.
PASEO_PROMETHEUS_* environment variables on the daemon override the saved values, and the settings screen lists the overrides that are active.
Access
The daemon sends read-only queries to the configured Prometheus URL, following any redirects, and does not connect to GPU hosts itself. Settings are saved in paseo-prometheus-status.json in the Paseo home directory, outside the plugin's own storage. The plugin creates that file with empty defaults when it loads.
Requires Paseo 0.8.0 or later.
This plugin entry was imported from paseo.cafe.